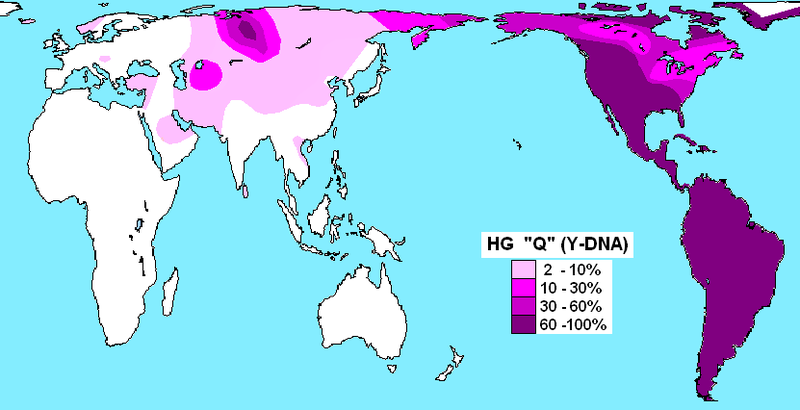
File:Haplogroup Q (Y-DNA).PNG
外观

本预览的尺寸:800 × 410像素。 其他分辨率:320 × 164像素 | 831 × 426像素。
原始文件 (831 × 426像素,文件大小:32 KB,MIME类型:image/png)
文件历史
点击某个日期/时间查看对应时刻的文件。
| 日期/时间 | 缩略图 | 大小 | 用户 | 备注 | |
|---|---|---|---|---|---|
| 当前 | 2020年10月11日 (日) 12:31 |  | 831 × 426(32 KB) | Maulucioni | Data for East Asia and Southeast Asia are overestimated. Reverted to version as of 05:04, 9 December 2011 (UTC) |
| 2020年5月16日 (六) 22:07 |  | 831 × 426(32 KB) | Satoshi Kondo | Reverted to version as of 02:30, 5 April 2020 (UTC) | |
| 2020年5月16日 (六) 15:55 |  | 831 × 426(31 KB) | SahinCcC | Reverted to version as of 22:41, 2 April 2020 (UTC) corrected wrong edit | |
| 2020年4月5日 (日) 02:30 |  | 831 × 426(32 KB) | SahinCcC | Reverted to version as of 01:51, 18 February 2020 (UTC) | |
| 2020年4月2日 (四) 22:41 |  | 831 × 426(31 KB) | SahinCcC | corrected Turkmen and Uyghur samples based on paternal lineages 30% to 60% in ethnic Turkmens | |
| 2020年2月18日 (二) 01:51 |  | 831 × 426(32 KB) | Ilber8000 | India update : South India update from Arunkumar et al. 2012, varies between 7%-1% from Table 2, and North India/Western India G. Mahal et al. (2017) - Highest in Jats at 15.6%, they give 4.2% average for all South Asia from Table 2. | |
| 2020年2月18日 (二) 01:45 |  | 831 × 426(32 KB) | Ilber8000 | Will update again with additonal source | |
| 2020年2月18日 (二) 01:11 |  | 831 × 426(32 KB) | Ilber8000 | South India update from Arunkumar et al. 2012, varies between 7%-1% from Table 2. | |
| 2019年12月22日 (日) 20:13 |  | 831 × 426(32 KB) | LenguaMapa | minor correction in southwestern india | |
| 2019年11月28日 (四) 20:17 |  | 831 × 426(32 KB) | LenguaMapa | further minor correction on India and Southeast Asia (Akha tribes etc.) |
文件用途
以下2个页面使用本文件:
全域文件用途
以下其他wiki使用此文件:
- ast.wikipedia.org上的用途
- azb.wikipedia.org上的用途
- ca.wikipedia.org上的用途
- es.wikipedia.org上的用途
- fi.wikipedia.org上的用途
- fr.wikipedia.org上的用途
- hi.wikipedia.org上的用途
- ja.wikipedia.org上的用途
- lv.wikipedia.org上的用途
- ru.wikipedia.org上的用途
- tr.wikipedia.org上的用途


