#!/usr/bin/python
# -*- coding: utf8 -*-

'''
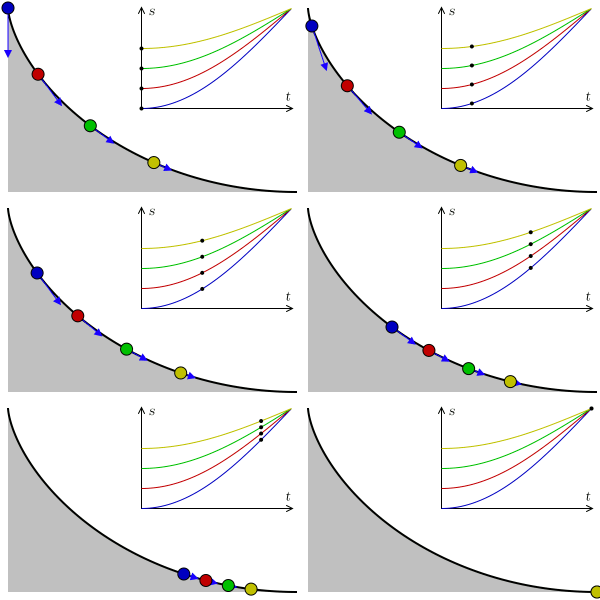
animation of balls on a tautochrone curve
'''

import os
import numpy as np
import matplotlib.pyplot as plt
import matplotlib.patches as patches
from matplotlib import animation
from math import *

# settings
fname = 'Tautochrone curve'
width, height = 300, 200
nframes = 80
fps=25

balls = [
{'a':1.0, 'color':'#0000c0'},
{'a':0.8, 'color':'#c00000'},
{'a':0.6, 'color':'#00c000'},
{'a':0.4, 'color':'#c0c000'}]

def curve(phi):
    x = phi + sin(phi)
    y = 1.0 - cos(phi)
    return np.array([x, y])

def animate(nframe, empty=False):
    t = nframe / float(nframes - 1.)

    # prepare a clean and image-filling canvas for each frame
    fig = plt.gcf()
    fig.clf()
    ax_canvas = plt.gca()
    ax_canvas.set_position((0, 0, 1, 1))
    ax_canvas.set_xlim(0, width)
    ax_canvas.set_ylim(0, height)
    ax_canvas.axis('off')

    # draw the ramp
    x0, y0 = 293, 8
    h = 182
    npoints = 200
    points = []
    for i in range(npoints):
        phi = i / (npoints - 1.0) * pi - pi
        x, y = h/2. * curve(phi) + np.array([x0, y0])
        points.append([x, y])

    rampline = patches.Polygon(points, closed=False, facecolor='none',
                       edgecolor='black', linewidth=1.5, capstyle='butt')
    points += [[x0-h*pi/2, y0], [x0-h*pi/2, y0+h]]

    ramp = patches.Polygon(points, closed=True, facecolor='#c0c0c0', edgecolor='none')

    # plot axes
    plotw = 0.5
    ax_plot = fig.add_axes((0.47, 0.46, plotw, plotw*2/pi*width/height))
    ax_plot.set_xlim(0, 1)
    ax_plot.set_ylim(0, 1)
    for b in balls:
        time_array = np.linspace(0, 1, 201)
        phi_pendulum_array = (1 - b['a'] * np.cos(time_array*pi/2))
        ax_plot.plot(time_array, phi_pendulum_array, '-', color=b['color'], lw=.8)
    ax_plot.set_xticks([])
    ax_plot.set_yticks([])
    ax_plot.set_xlabel('t')
    ax_plot.set_ylabel('s')

    ax_canvas.add_patch(ramp)
    ax_canvas.add_patch(rampline)

    for b in balls:
        # draw the balls
        phi_pendulum = b['a'] * -cos(t * pi/2)
        phi_wheel = 2 * asin(phi_pendulum)
        phi_wheel = -abs(phi_wheel)
        x, y = h/2. * curve(phi_wheel) + np.array([x0, y0])
        ax_canvas.add_patch(patches.Circle((x, y), radius=6., zorder=3,
                            facecolor=b['color'], edgecolor='black'))
        ax_plot.plot([t], [1 + phi_pendulum], '.', ms=6., mec='none', mfc='black')

        v = h/2. * np.array([1 + cos(phi_wheel), sin(phi_wheel)])
        vnorm = v / hypot(v[0], v[1])
        # in the harmonic motion, acceleration is proportional to -position
        acc_along_line = 38. * -phi_pendulum * vnorm
        ax_canvas.arrow(x, y, acc_along_line[0], acc_along_line[1],
                 head_width=6, head_length=6, fc='#1b00ff', ec='#1b00ff')

fig = plt.figure(figsize=(width/100., height/100.))
print 'saving', fname + '.gif'
#anim = animation.FuncAnimation(fig, animate, frames=nframes)
#anim.save(fname + '.gif', writer='imagemagick', fps=fps)

frames = []
for nframe in range(nframes):
    frame = fname + '_{:02}.png'.format(nframe)
    animation.FuncAnimation(fig, lambda n: animate(nframe), frames=1).save(
        frame, writer='imagemagick')
    frames.append(frame)

# assemble animation using imagemagick, this avoids dithering and huge filesize
os.system('convert -delay {} +dither +remap -layers Optimize {} "{}"'.format(
    100//fps, ' '.join(['"' + f + '"' for f in frames]), fname + '.gif'))
for frame in frames:
    if os.path.exists(frame):
        os.remove(frame)


