跳至內容

File:Sinc function (both).svg

頁面內容不支援其他語言。
這個檔案來自維基共享資源
維基百科,自由的百科全書

原始檔案 (SVG 檔案,表面大小:1,300 × 975 像素,檔案大小:42 KB)


摘要

描述
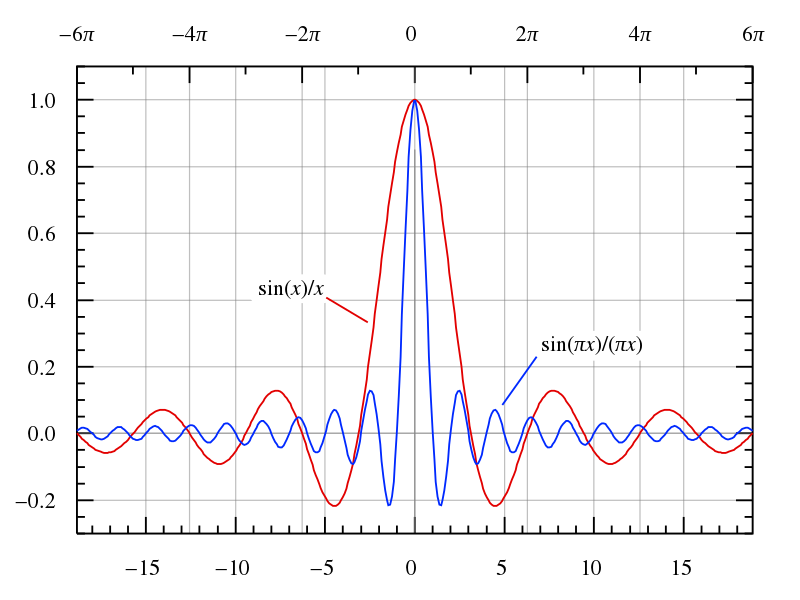
English: Graph of both the normalized (sin(πx)/(πx)) and unnormalized (sin(x)/x) definitions of the sinc function.

These are on the same scale. The second axis is just to clarify that the zero crossings occur on multiples of pi instead of integers.

Mathworld's version

Instructions:
See Wikipedia graph-making tips.

Then I opened the resulting SVG file in Inkscape, copy and pasted the Unicode π characters and modified those labels by hand, changed the line colors, brought the plot lines to the top, made all the lines 3 px wide, made the grid lines 2px wide and 50% transparency. I also manually reconnected the grid lines that were cut by the legend function, moved the legends down next to the graph, converted their example lines into directional arrow type lines, and put a white box behind the text instead of trying to cut the graph lines like gnuplot does.
日期 2006年6月3日 (上傳日期)
來源 自己的作品
作者 Omegatron
其他版本
SVG開發
InfoField
 
SVG檔案的原始碼通過W3C驗證
 
向量圖形使用Gnuplot創作。
 
以及使用 Inkscape.
 
這個SVG 檔案使用了內置文字。
gnuplot source
InfoField
click to expand
# Set 1300×975 SVG output and filename
# The font size (fsize) sets the size for the circles, too.
set samples 400
set terminal svg enhanced size 1300 975 fname "Times" fsize 36
set output "sinc function (both).svg"

# Set y axis limits so the plot doesn't go right to the edges of the graph 
set yrange [-0.3:1.1]
set xrange [-6*pi:6*pi]

set lmargin 5
set bmargin -10

# No legend needed
#set nokey

# Add lightly-colored axis lines
set yzeroaxis
set xzeroaxis

# Put a y-axis tic at every 0.2
set ytics 0.2
set mytics 4

# Put an x-axis tic at every integer
set xtics 5
set format x "%2.0f"
set mxtics 5

# Put a second x-axis tic at every multiple of 2*pi

set x2tics 2*pi
set format x2 "%2.0f"
set mx2tics 2
set grid x x2 y
set xtics nomirror

# Format tics as digit with one decimal place
set format y "%2.1f"

# Plot as lines
plot sin(x)/x with lines, sin(pi*x)/(pi*x) with lines
 
# Close the file (so I don't have to close gnuplot to view it)
set output

授權條款

我,本作品的著作權持有者,決定用以下授權條款發佈本作品:
w:zh:共享創意
姓名標示 相同方式分享
此檔案採用創用CC 姓名標示-相同方式分享 3.0 未在地化版本2.5 通用版2.0 通用版以及1.0 通用版授權條款。
您可以自由:
  • 分享 – 複製、發佈和傳播本作品
  • 重新修改 – 創作演繹作品
惟需遵照下列條件:
  • 姓名標示 – 您必須指名出正確的製作者,和提供授權條款的連結,以及表示是否有對內容上做出變更。您可以用任何合理的方式來行動,但不得以任何方式表明授權條款是對您許可或是由您所使用。
  • 相同方式分享 – 若要根據本素材進行再混合、轉換或創作,則必須以與原作相同或相容的授權來發布您的作品。
GNU head 已授權您依據自由軟體基金會發行的無固定段落、封面文字和封底文字GNU自由文件授權條款1.2版或任意後續版本,對本檔進行複製、傳播和/或修改。該協議的副本列在GNU自由文件授權條款中。
您可以選擇您需要的授權條款。

說明

添加單行說明來描述出檔案所代表的內容

在此檔案描寫的項目

描繪內容

沒有維基數據項目的某些值

作者姓名字串 繁體中文 (已轉換拼寫):​Omegatron
維基媒體使用者名稱 繁體中文 (已轉換拼寫):​Omegatron

著作權狀態 繁體中文 (已轉換拼寫)

有著作權 繁體中文 (已轉換拼寫)

檔案來源 Chinese (Taiwan) (已轉換拼寫)

上傳者的原創作品 繁體中文 (已轉換拼寫)

多媒體型式 繁體中文 (已轉換拼寫)

image/svg+xml

檔案歷史

點選日期/時間以檢視該時間的檔案版本。

日期/時間縮⁠圖尺寸用戶備⁠註
目前2020年3月24日 (二) 17:12於 2020年3月24日 (二) 17:12 版本的縮圖1,300 × 975(42 KB)AkanoToEItalicized variables
2006年6月3日 (六) 18:08於 2006年6月3日 (六) 18:08 版本的縮圖1,300 × 975(42 KB)Omegatron

下列頁面有用到此檔案:

全域檔案使用狀況

以下其他 wiki 使用了這個檔案:

詮釋資料